


Tracking How Many People Have Seen Your Facebook Posts

Facebook Insights – and all of the social media dashboards that pull data from it – can give you a ton of information about your audience and their activity. Sometimes, though, it can be tricky to find the simple metrics you might want to measure.
Recently, Facebook announced that they were going to tweak the algorithm that determines who sees what posts and when. Their new version of the algorithm emphasizes friends and family over businesses and sponsored posts. Businesses, of course, see this as a threat; it decreases page reach, it means fewer people see posts, and it means to keep up the same exposure as before the change, they would have to ramp up paid ads.
The cynical among us consider this a move by Facebook to try to get as much money out of the site as possible before its inevitable collapse. The realists among us recognize that the people who use Facebook tend to use it to keep in touch with friends and family, and that business posts pushing away those friends and family means users are more likely to leave the site. The optimists among us have all actually quit marketing for something less depressing.
But I digress. If you’re running a Facebook business page, chances are pretty good you want to see just how many people are seeing your posts, and use that data to benchmark your growth over time. Here’s how you can do it.
About Facebook Reach
Facebook measures a few different but related metrics when you’re talking about who sees your posts. It can be a little confusing to understand what is what.
First up, you might see a metric called Pageviews. Pageviews are a simple hit counter. Any time someone visits your Facebook page, regardless of whether or not they’re logged into their Facebook accounts, it increments this counter by 1. If one person views your page once per day for a week, they will give you 7 pageviews.
Secondly, you might see Impressions. An impression is any instance where your page or a piece of content from your page shows up in the feed or on the screen of a user. Note that the user doesn’t have to interact with the post in any way, and in fact might not even see it. If they load their feed and then close the browser because of a local distraction, that’s still an impression for you.
Third, you’ll definitely see Reach. Reach is a metric very similar to Pageviews, except it tracks unique views instead of any view. If one person sees three different posts from your page, your page will have +1 reach. Each individual post, meanwhile, will have +1 reach. If that person refreshes the page and sees all three posts again, the counter will not change. Reach is a count of people, not of hits or views.
Reach comes in several flavors. First up, you have Page reach. Page reach is the reach as counted throughout all of your content and your page itself. It’s the number of people who have seen you. If you think about a stand-up comedian, Page Reach would be the number of people who have seen that comedian perform before.
Post reach is the other flavor of Reach. In the comedian analogy, it’s the number of people who have seen each individual show. The reach is counted per show, so one person seeing a show twice is only counted as one person, but that same person seeing two different shows counts as one reach for each show. Still with me?
Post reach can be further divided into Viral and Non-Viral reach. Viral reach is the number of people who have seen content from your Page because of some kind of share. A friend of theirs likes your page or shares your post, etc, any engagement that generates an interaction the user can see. Non-Viral reach is the people who see your content directly, because they visited your Page or because they follow your Page and see your content in their feed.
Both of these kinds of reach can be terms Organic reach. There is further Paid reach, which is reach that occurs because you paid to boost a post or promote your account. It is specifically reach you have paid for.
Viewing Reach
If you want to see any of your reach numbers, you can do so through Facebook Insights. Start by logging into Facebook. The account you log into needs to be either the owner of the Page or appointed to some non-user role. Analyst, Advertiser, Moderator; all of the Page Roles can view Insights.
Once you are logged in, click the drop-down arrow in the upper right corner of the screen, on the blue bar, next to the question mark. Click on the name of the Page you want to view Insights for, and you will be taken to that Page.
At the top of the Page, above the cover photo but below the search box, you will see a line of entries. You should see Page, Inbox, Notifications, Insights, Publishing Tools, and Promotions. Click on Insights.
In the Insights panel, you will see a lot of information. A few relevant pieces of information are visible right away. You can see Page Views, which will count the number of times your posts were seen, but is not an accurate count of people. Below it, you can see Reach, which will be your aggregated Page Reach. Since we’re looking for reach on a per-post level, you’ll need to do a little deeper digging.
On the left sidebar, you should see a bunch of options, starting with Overview. A few further down, you will see Reach. This is, again, PAGE reach, not POST reach, so it won’t give you the information you want to see. Instead, skip a little further down, to where Posts is visible. Click that one.
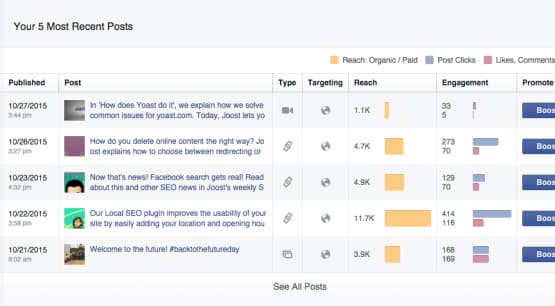
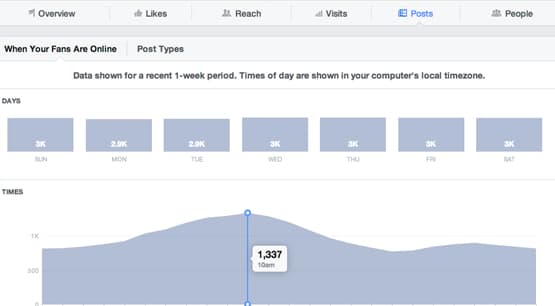
On this window, you will see more relevant information. At the top, you will see some information about when your fans are online. A tab next to it will allow you to sort your posts based on post type, and will show you aggregated stats for each type.
Below all of that, you will see an “all posts published” box. This will have several columns. One is the date and time a post was published. Next is the preview image and text of the post, along with a link to that post. After that is the type of post, and then the targeting. Then you have Reach and Engagement as columns, both of which are the meat of what we’re trying to view.
In the Reach column, you will see a bar that shows the total amount of reach each post has received. If all you want to know is the number of people who have seen a post, that’s your number. It’s the sum total of all organic and paid reach.
However, one user can count for both types of reach. If they saw the post organically, and then later saw it as an advertisement, they will count for both. Additionally, for large pages, reach becomes an estimated number. It will be fairly accurate in both cases, but keep in mind that it’s a little fuzzy, so it might be plus or minus 1% or so depending on volume of data.
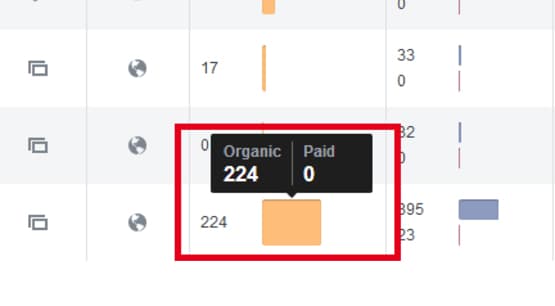
If you hover over the bar for reach for any post, you can see the number divided up. It will show you both organic and paid as their own numbers, so you can see if there’s overlap.
As for the engagement column, you see two bars. One is for clicks on the post, which can be clicks leading to your page or clicks through to the link. The other is for reactions, comments, and shares all combined.
Above this table, you have a couple of drop-down options you can use to further view the data in different ways.
The first drop-down is next to the orange box that says Reach. If you click it, you see several options. These options are Reach, Reach: Organic/Paid, Impressions: Organic/Paid, and Reach: Fans/Non-Fans.
- Reach – This removes the ability to hover over the box and see the differentiation between types of reach. There’s virtually no reason to ever choose this option.
- Reach: Organic/Paid – This is the default option as described above.
- Impressions: Organic/Paid – This changes the reach number to an impressions number. This will generally be a higher number, as it measures impressions instead of people. It is divided between organic and paid on hover, like the previous option.
- Reach: Fans/Non-Fans – This is your Reach number as listed above, except instead of showing you the difference between organic and paid reach, it shows you the difference in reach between fans and non-fans. This can be useful to see if your reach is lower amongst one group or the other, and if efforts to boost one or the other are effective.
The other drop-down is options for the Engagement column. The default is two bars, one for clicks and one for reactions, comments, and shares. There are three other options you can pick from.
The first is simply reactions, comments, and shares. This will show all three types of engagement as different bars for each post entry, which can be useful to see the raw numbers for each.
The second option is the “negative engagement” box. It shows you detrimental actions, including instances where a user hid a post, hid all of your posts, reports a post as spam, or unlikes your page.
The third option is simply an engagement rate calculation. It takes the number of engagements and divides it by the total reach, showing you what percentage of the people you reached went on to engage with the post. Higher engagement rates are, obviously, better.
Metrics You Can’t Track
There are a few metrics you might want to track but, due to the limitations of Facebook Insights, you cannot.

The first is the number of concurrent viewers. If you wanted to see how many people are currently viewing your page, or any historical data about volumes of people viewing your page at any given time, you can’t. Facebook will show you aggregate information about when your fans are online, but you can’t see anything more detailed. The best you can do is compare the peak hours and your engagement rates for posts made during that time, which you then measure within an hour. Overall, it’s too much work for data that won’t actually be useful or accurate.
You also cannot see all-time historical data. Facebook divides data based on time and will show you data for a week, a month, or a quarter, but that’s about it. Even your “total page reach” metrics are based on the most recent month, in general. You might be able to use a third party analytics suite to get historical data, but it takes that data starting when you start using the app. You won’t be able to pull data further back than Facebook allows you to access.
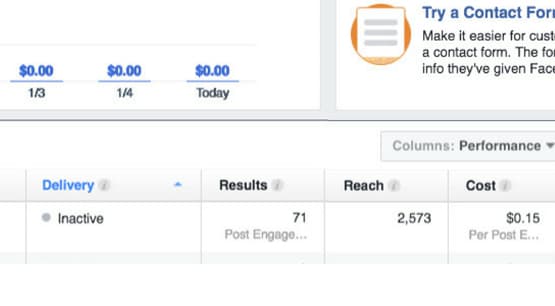
One of the most annoying bits of data you can’t see is a divided version of post clicks. You often want to see how many people clicked a post link and visited your site, but you can’t see that through Insights. The post click data Facebook provides is any click, including clicks to react, clicks to comment, clicks through to your page, and even clicks to expand a description.
If you want to get referral data, you will have to use Google Analytics and tag your posts with UTM parameters. This is easy to do, thankfully, but it still means you need to use a different analytics system and implement tracking code if you want to see the metrics.