


What is The Average Engagement Rate Per Post on Facebook?
It’s human nature to compare yourself to those around you. The urges that lead to competition between tribes, to competitions between nations, to the “keeping up with the Joneses” phenomenon, they’re all the same. It’s no different in business. You want to see how you compare to those around you, in your industry, on your social media platforms, and everywhere else.
What are the average engagement rates for Facebook posts? I know you’ve thought the question before, even if you’ve kept it to yourself. You want to know, right? How your own engagement rates compare. Are you ahead of the pack, or are you below the curve? Should you be proud of your marketing efforts, or scrambling to catch up?
Three Types of Average
When it comes to comparing yourself to others on Facebook, you have three ways you can do it. I call these the three averages, but it’s far from an official term. Essentially, there are just three different data sets you can look at.
The first average is the average of all posts made by all brands on Facebook, and their engagement rates. Take every bit of engagement on every brand post on Facebook and divide it by the number of posts, and you have the average engagement rate. Don’t bother to look at engagement on organic profile posts; they’re treated so differently that it’s not worthwhile data. You just want to compare yourself to other brands.
The second average is the average post engagement amongst all brands in your industry. A small town news company or local news station can compare their engagement rates to everyone from their competitors across the street to CNN and MSNBC.
The third average is the average post engagement amongst your direct competitors. This is a much more limited data set, because you’re just looking at a few companies you know compete in the same space you do. This cuts out dramatically different scales of operation that skew the averages, like the no-name, no-sale businesses with zero engagement, and the big name businesses you’re still too small to be noticed by.
All three type of average are worthwhile to learn, for different reasons. The first average is useful just as an absolute basic benchmark. If you know the average engagement rate across all posts on Facebook, you can see if you’re doing better or worse than average. When you think about the thousands upon thousands of brands with posts that get zero engagement at all, you understand that this benchmark is more of a baseline. If you’re not doing at least this well, you need to start working a little harder on your social media strategies.
The second type of average, meanwhile, is going to be a more reasonable benchmark for you to aim to beat. Different industries have different levels of representation on social media. B2B brands have a harder time marketing on the largely B2C platform, after all. Some industries simply struggle to write anything interesting to a broad consumer base. There are only so many people interested in industrial pipe fittings at any one time. A video game company comparing their engagement rates to a musician, comparing to a plumber, comparing to a doctor, are all going to have different baselines and different averages worth comparing.
The third type of average is the most immediately relevant to your brand, but it’s also the least reliable in terms of data. You have a small sample size, however many brands use Facebook and are direct competitors of yours, and however many posts they make in a given time. This can be skewed pretty easily by one viral post, meaning you need longer time spans to take better averages. Even so, it’s a good metric to know, because it helps you see where you compare to the most relevant average to your brand.
Looking Into Data, 2017 and 2018
I don’t have the resources personally to look at any representative sample of Facebook pages. I don’t have the tools or the time on my hands to perform such a case study. Luckily, I don’t have to. There are a number of big data brands that do their own studies. One such brand is RivalIQ. This brand produces a report each year on engagement rates across Facebook, Instagram, and Twitter.
First, let’s look at the 2017 data. A representative sample of 120 companies per industry out of a database of over 100,000 was chosen. They all have somewhere more than 25,000 followers but under a million, and they were all active in the previous year. I’ll be ignoring the Instagram and Twitter data, but if you want to look at it yourself, feel free.
The industries chosen are fairly broad. The came in six categories: media, higher education, non-profits, food and beverage, fashion, and heath and beauty. Obviously, there are a number of other industries, and each industry can be broken down into sub-industries and niches if they wanted, but this is a broad overview, not a narrow drill-down.
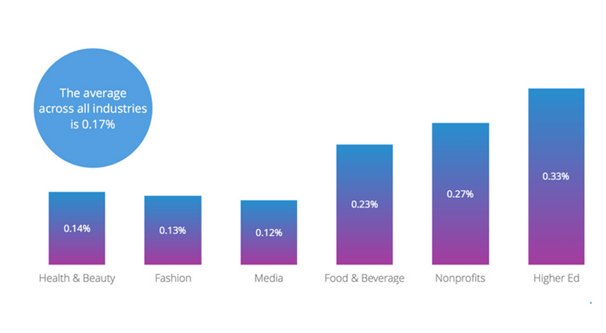
- The average engagement rate per post on Facebook, across all industries, is 0.17% in 2017.
- Media brands have the lowest engagement rates at .12%, while higher education brands have the highest at .33%.
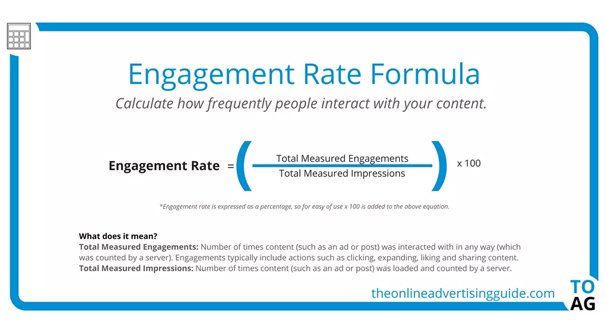
Remember that engagement rate is a calculation using the number of individual engagement actions – a comment, a like, a share – compared to the number of people following the account. Engagement divided by followers, with the result multiplied by 100 to get the percentage.
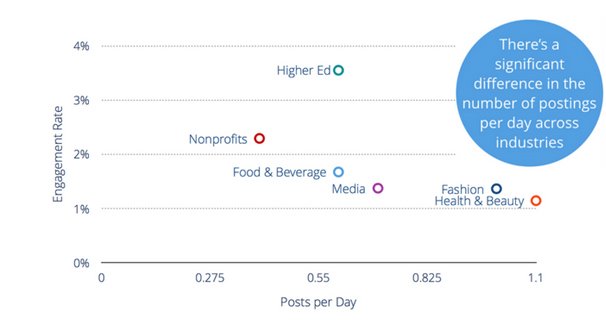
It’s interesting to note that there is some variation between individual industries, along with some other benchmarks. For one thing, most brands in most industries post 1-2 times per day on average. Media brands, meanwhile, post nearly 8-10 times per day. When you look at a brand like Forbes, covering a wide swath of content, it’s reasonable to see that they can post a lot more often than other, smaller brands with narrower content focuses.
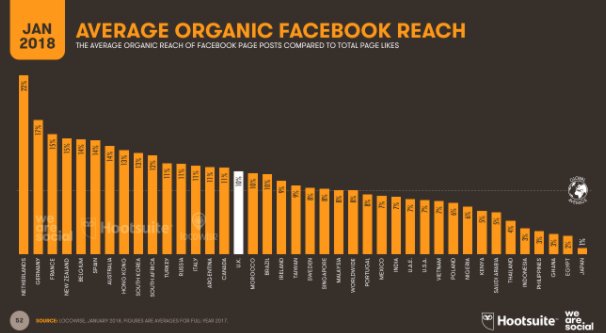
Now let’s shift gears to 2018. Some major changes have hit social networks in the past year, including a big change to Facebook that limits brand reach while promoting organic posts from friends and family. Unfortunately, this data is largely measured prior to the announcement of this change; you’ll have to wait for the 2019 report to see the effects of the change.
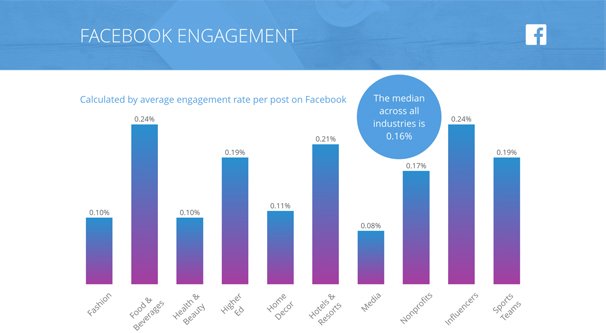
With the 2018 report, RivalIQ made a few changes. Their industry list expanded to include sports teams, influencers, hotels and resorts, and home décor brands. They also expanded from 120 companies per industry to 150, adding more data to the sample. This should make the data more accurate across individual industries.
- The average engagement rate per post on Facebook, across all industries, is 0.16% in 2018.
- Media brands dropped to .08%, with fashion and health at .1% and home décor at .11%.
- Higher education dropped significantly to .19%.
- Food and beverage, hotels, and influencers all range in the .2 to .24% zone.
While these numbers may seem large – the difference between 8 and 24 – but keep in mind these are all tenths or hundredths of a single percentage point. We’re talking very small scale changes that are only meaningfully relevant in terms of raw numbers when you have hundreds of thousands or millions of followers.
Where Your Data Stacks Up
This is where things get a little tricky. Facebook has engagement rate numbers in your Facebook Insights panel, so you might think that you can drop in and pull that data, compare it to the benchmark averages, and see where you stand. Unfortunately, the data is not calculated in the same way. There are two major differences in the data.
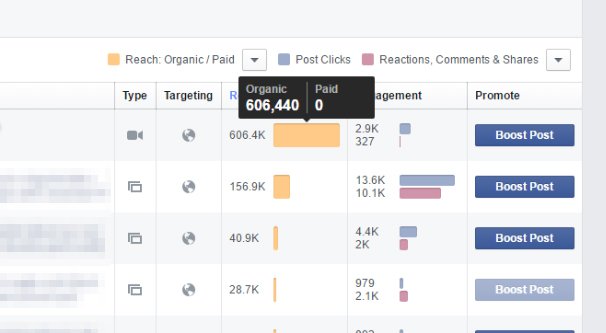
The first is that Facebook calculates engagement rate based on the reach of the post. You could have 100,000 followers, but if 90,000 of them are inactive and only 10,000 saw your post, your reach is 10,000. That increases your engagement rate number by an order of magnitude. If you saw your industry average engagement rate as .15% and saw your own as 1.5%, you’d think you had an excellent time, when in reality the numbers aren’t created equally.
The second is that Facebook calculates the raw number of engagement actions using more than the obvious metrics; likes/reactions, comments, and shares. The main element Facebook considers in their average that RivalIQ does not is clicks. Link clicks, clicks through to your profile from the post, clicking to view an expanded photo; these are all measured as part of post engagement in Insights.
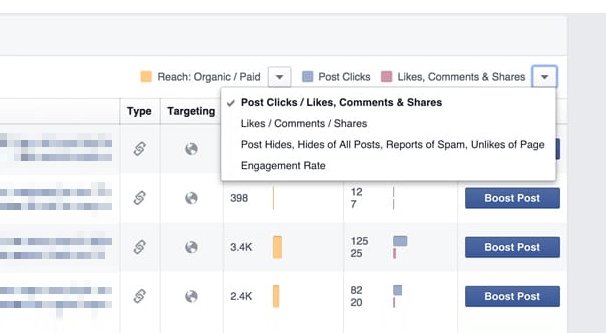
What this means is that your number of engagement actions will be higher and your number of people in your audience will be lower, resulting in much higher average engagement rates. The two data sets are incomparable.
In order to compare your own data to that of RivalIQs averages, you will need to calculate it yourself. Go back through the last six months or the last year of posts you’ve made on your page. For each post, count the number of reactions, comments, and shares the post received. Take this number and divide it by the total number of followers you have on your account, your Facebook Fans. Remember; RivalIQ has to use public data. They can’t see your link clicks or your post reach, so they have to use data they can see publicly.
Calculate your average engagement rate by taking the total number of engagement actions, dividing it by the number of followers your page has, and then multiply the whole thing by 100. This will give you the percentage calculated the same way as the data I’ve linked to above.
Where Do You Stand?
When you have your own accurate data to use for comparison, you can figure out where you stand relevant to the industry that most matches your own. If your industry isn’t represented in the data, you’ll need to choose the closest match, or even perform an industry survey of your own. After all, the number of followers and the number of engagement actions is public; you can do this study on any page you have the patience to scrape.
I figure you can categorize yourself into one of five positions.
- Much higher. If your engagement rate is significantly higher than the industry average engagement rate, congratulations! You’re doing something right. You’re leading the pack, and are setting the example for others to follow, even if it’s on a smaller scale than the typical industry leaders.
- Slightly higher. If your engagement rate is only a few hundredths of a percentage point higher than the industry average, you’re on the right track. You might not be an industry leader, but you’re not doing poorly.
- The same. If your engagement rate is within .01% of the industry average, well, you’re the industry average. This isn’t a bad place to be, but there’s always room for improvement.
- Slightly lower. If your engagement rate is a little lower than the industry average, well, now you know. You may want to look into some more optimizations, maybe culling some bad followers from your audience, and possibly paying for post boosting.
- Much lower. If your engagement rate is quite a bit lower than the industry average engagement rate you measured, you have some work to do. It’s a sign that you’re using the platform incorrectly, somehow, and that you need to clean up your act to pull yourself up to par.
And, of course, you should probably build a narrower data set amongst your direct competitors. A brand like Amazon is going to have dramatically different engagement rates than a small, local grocery store. Compare apples to apples with any data you can get your hands on.
Where can I actually see the average percentage engagement of my posts? Would love to compare it to these stats. Do I have to follow a formula to find that figure? Thank you 🙂